PSpice Examples for EE-202
Schematics Netlist
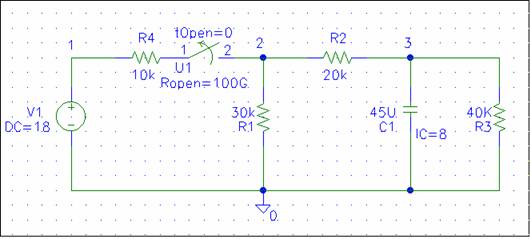
V_V1 1 0 DC 18 R_R4 1 $N_0001 10k R_R1 2 0 30k X_U1 $N_0001 2 Sw_tOpen PARAMS: tOpen=0 ttran=1u Rclosed=0.1m + Ropen=100G R_R2 2 3 20k C_C1 3 0 45U IC=8 R_R3 3 0 40K
In PROBE, select plot control and add plot to create two graphs on the screen. Use select graph, up and down key to obtain a plot of voltage V(3) and current I(C1). On the voltage graph draw a line at .3678*8 and use the cursor command to locate the time constant. 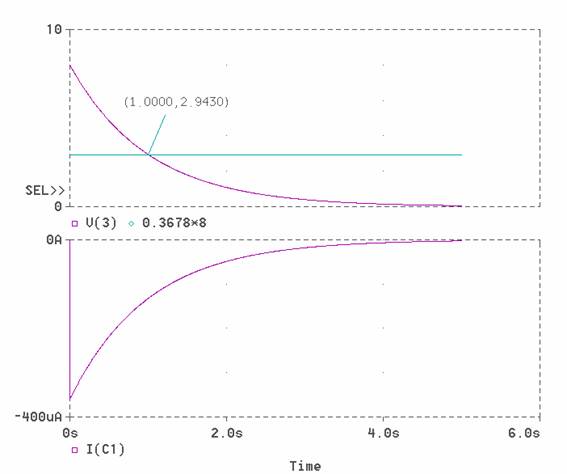
Top of Page
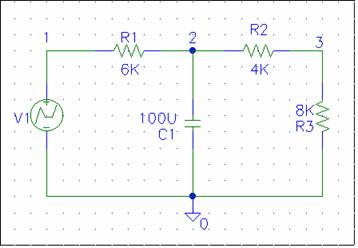
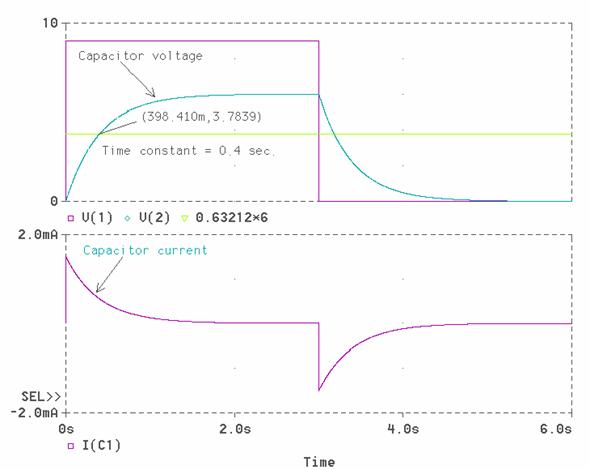
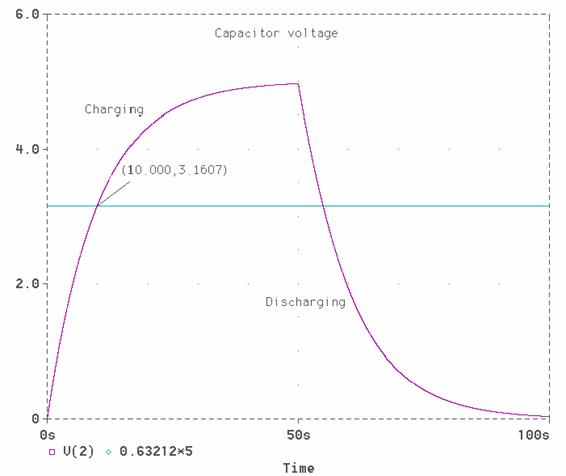
Top of PageConsider the network below in which the voltage input is a square pulse as shown. Use the VPWL function to generate this square pulse. Use PSPICE and PROBE to obtain the transient response of the capacitor voltage and capacitor current separately on one page. In the Transient Analysis use a final value of 6 second. On the voltage graph add a trace at 63.2% of capacitor final voltage and use the cursor command to locate the circuit time constant.
Schematics Netlist
V_V1 1 0 +PWL 0 0 0.000001 9 3 9 3.000001 0 R_R1 1 2 6K R_R2 2 3 4K C_C1 2 0 100U IC=0 R_R3 3 0 8K
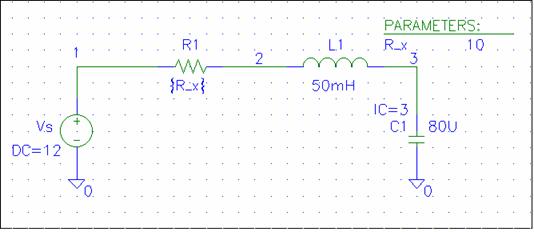
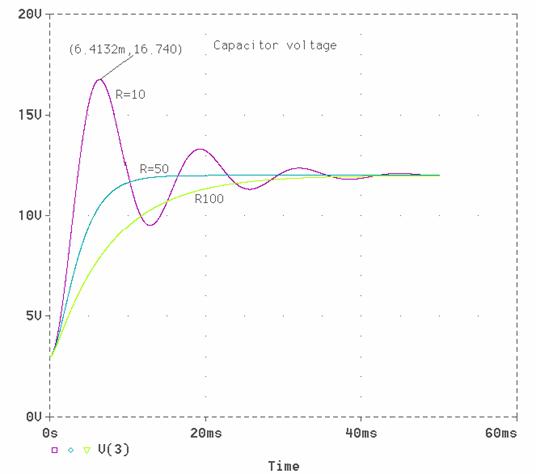
In the series RLC circuit shown the switch is closed at t = 0. The initial voltage across the capacitor is 3 volts. The resistance in the circuit is variable. Obtain the transient response for the voltage across the capacitor for R = 10W, 50W, and 100W. In the Transient Analysis use a final value of 50 ms.
In the Probe, from Tools pull-down menu select Cursor and check the Display and use Peak to find the peak value of the response and the time to reach this peak for the underdamped response. From the Tools pull-down menu use Label and Mark to mark the values for the peak point.
Schematics Netlist
V_Vs 1 0 DC 12 L_L1 2 3 0mH IC=0 C_C1 3 0 80U IC=3 R_R1 1 2 {R_x}
Example 4
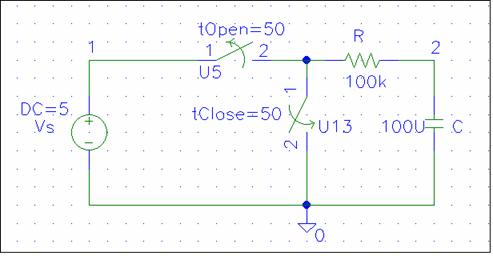
In the circuit shown the uncharged capacitor is charged for a duration of 50 seconds, it is then discharged immediately. Use Spice and Probe to obtain the capacitor
voltage during charging and discharging process.
Schematics Netlist
V_Vs 1 0 DC 5 R_R $N_0001 2 100k C_C 2 0 100U IC=0 X_U5 1 $N_0001 Sw_tOpen PARAMS: tOpen=50 ttran=50 Rclosed=.1m + Ropen=1000G X_U13 $N_0001 0 Sw_tClose PARAMS: tClose=50 ttran=1u Rclosed=.01m + Ropen=1000G
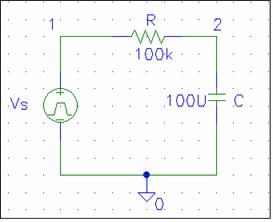
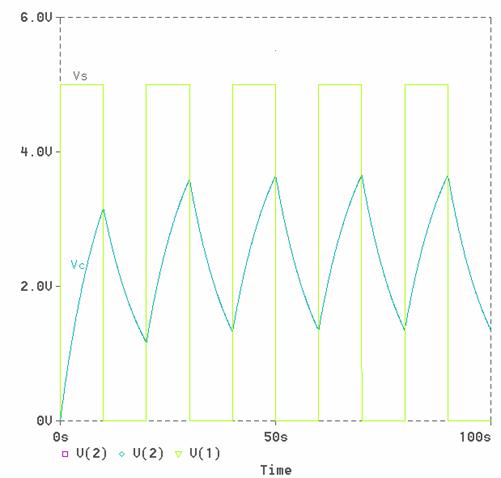
 Top of Page The capacitor in the RC circuit
of Example 4 is being charged for 10 seconds and then discharged for the next
10 seconds repeatedly. Use Spice and Probe to obtain the capacitor voltage for
this cyclic charging and discharging process up to 100 seconds.
We can use a VPULSE source to simulate the on off switching action. The pulse has an initial value of 0 V, a final value of 5 V, a pulse width of 10 seconds and a period of 20 seconds.
Schematics Netlist
R_R 1 2 100k C_C 2 0 100U IC=0 V_Vs 1 0 +PULSE 0 5 0 0 0 1 0 20
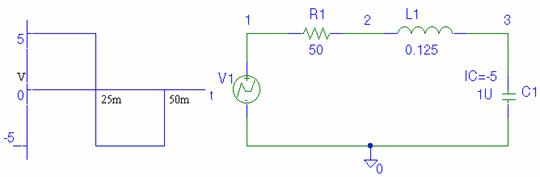
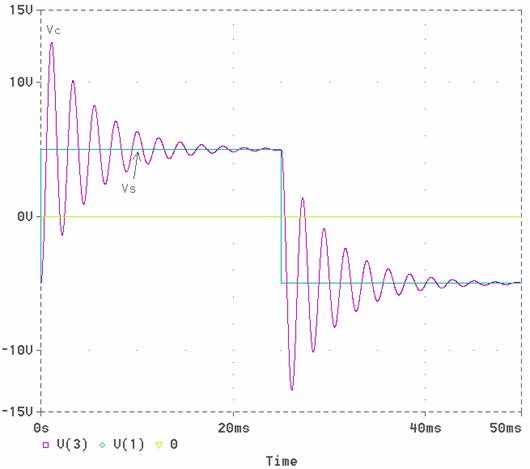
The voltage pulse shown is applied to the series RLC circuit as shown. Obtain the response for the voltage across the capacitor. Assume the initial charge on the capacitor is -5 V.
We can use the Piecewise Linear Voltage source VPWL to represent the above pulse. The VPWL by a series of points. Each pair of values (T1, V1) specifies the time and the value. Specified times T1, T2, T3, ... must be continuously increasing.
V_V1 1 0 +PWL 0 ‑5 0.00001m 5 25m 5 25.00001m ‑5 50m ‑5 50.00001m 0 R_R1 1 2 50 L_L1 2 3 0.125 C_C1 3 0 1U IC=‑5
 |